How to Group Data in a Pivot Table (2026)
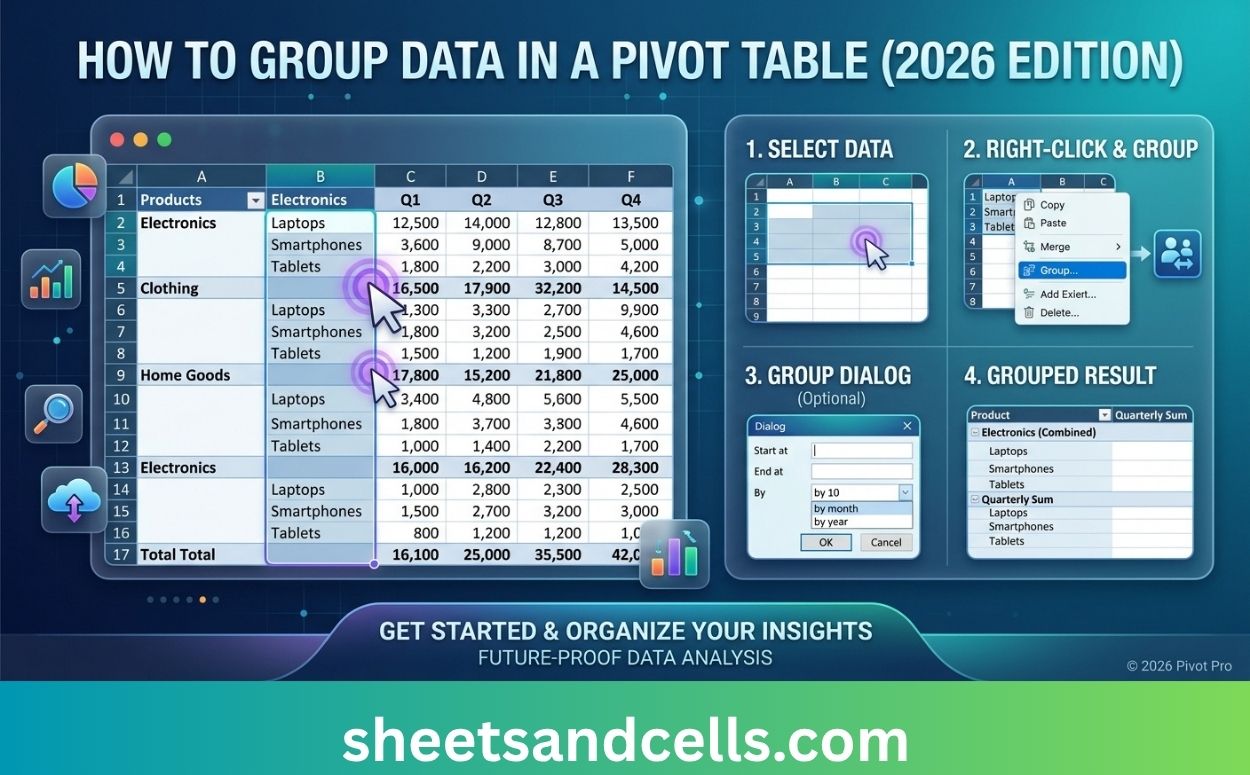
How to Group Data in a Pivot Table (2026)

How to Group Data in a Pivot Table (2026 Guide) Sheets & Cells Functions Pivot Tables Charts Google Sheets Excel AI Home›Pivot Tables›Group Data ExcelHow-To⏱ 2 min read How to Group Data in a Pivot Table (2026) Grouping turns raw values into meaningful buckets — dates into months and quarters, numbers into ranges, individual items … Read more
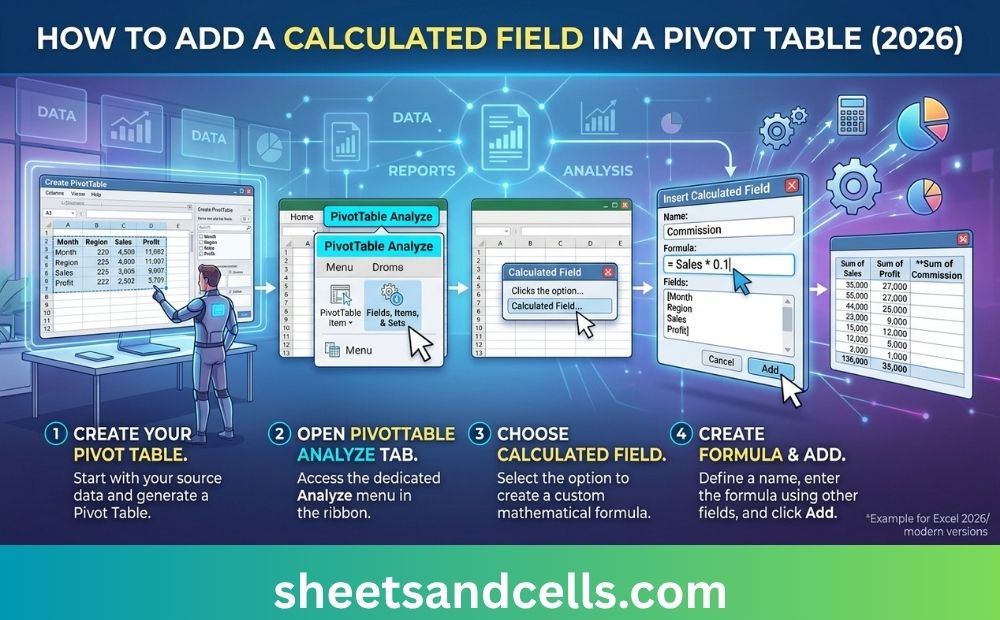
How to Create a Pivot Table in Excel (2026)

How to Create a Pivot Table in Excel (2026)

How to Create a Pivot Table in Excel (2026 Guide) Sheets & Cells Functions Pivot Tables Charts Google Sheets Excel AI Home›Pivot Tables›Create a Pivot Table ExcelHow-To⏱ 3 min read How to Create a Pivot Table in Excel (2026) Pivot tables summarize thousands of rows into an answer in seconds. This guide covers the fastest … Read more

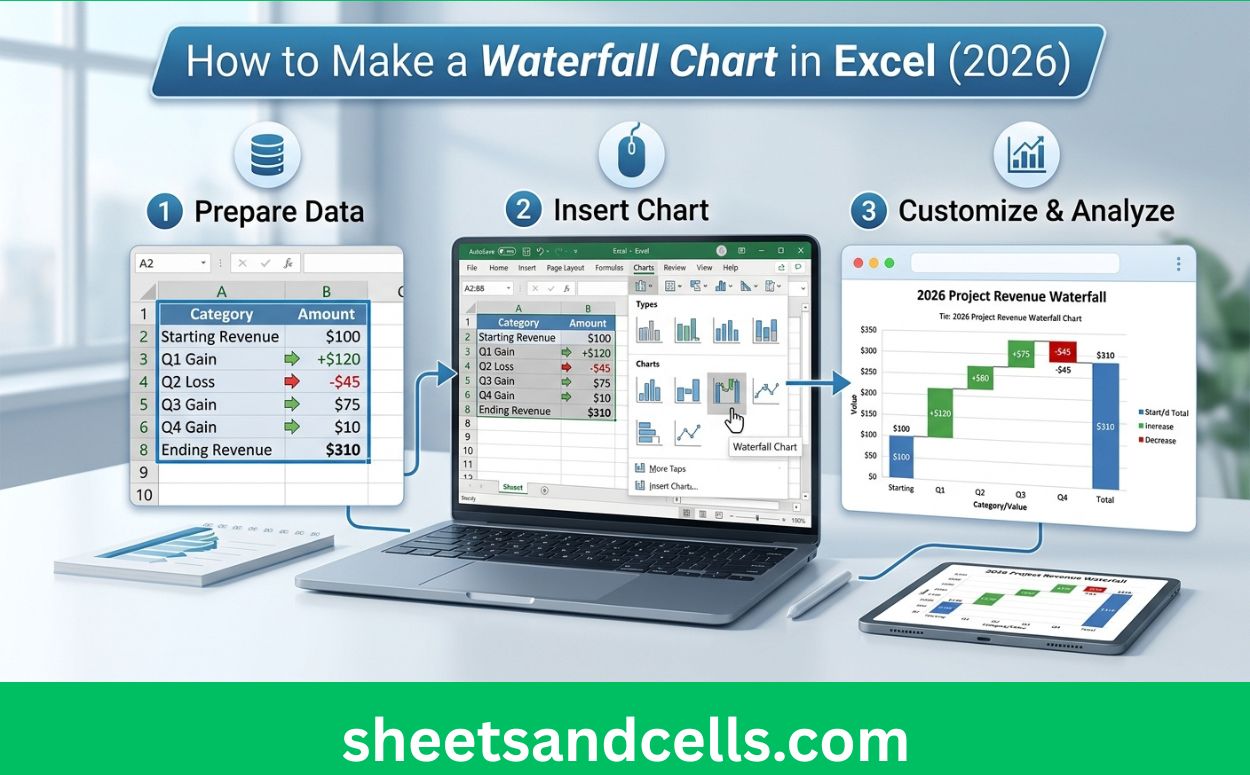
How to Make a Waterfall Chart in Excel (2026)

How to Make a Waterfall Chart in Excel (2026)

How to Make a Waterfall Chart in Excel (2026 Guide) Sheets & Cells Functions Charts Google Sheets Comparisons Excel AI Home›Excel Charts›Make a Waterfall Chart ExcelHow-To⏱ 3 min read How to Make a Waterfall Chart in Excel (2026) Waterfall charts explain how a value changes from a starting point to an ending point through additive … Read more

How to Make a Scatter Plot in Excel (2026)

How to Make a Scatter Plot in Excel (2026)

How to Make a Scatter Plot in Excel (2026 Guide) Sheets & Cells Functions Charts Google Sheets Comparisons Excel AI Home›Excel Charts›Make a Scatter Plot ExcelHow-To⏱ 2 min read How to Make a Scatter Plot in Excel (2026) Scatter plots show the relationship between two numeric variables — perfect for correlation analysis, outlier detection, and … Read more

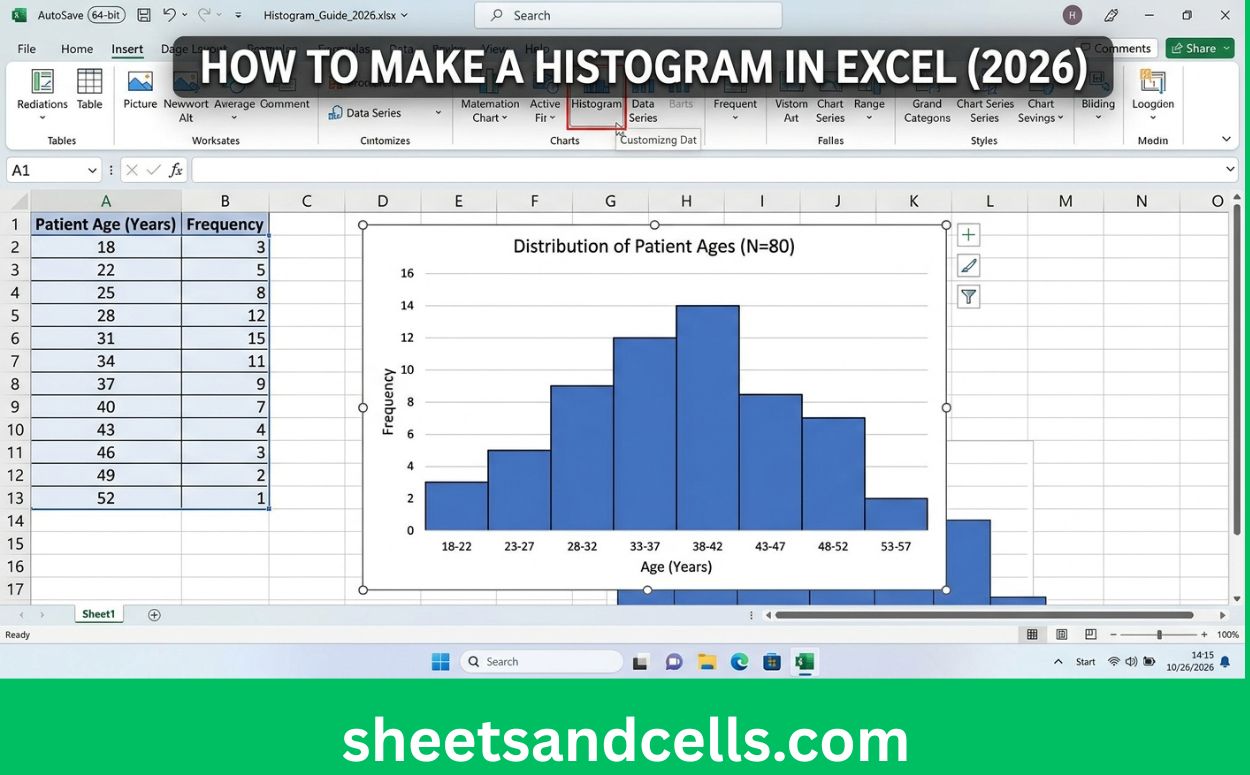
How to Make a Histogram in Excel (2026)

D. South Africa — 9 provinces. First Southern African hub. GNU coalition under Ramaphosa post-2024 elections, ANC-DA governing partnership, load-shedding recovery, complex racial-economic politics.

How to Make a Histogram in Excel (2026 Guide) Sheets & Cells Functions Charts Google Sheets Comparisons Excel AI Home›Excel Charts›Make a Histogram ExcelHow-To⏱ 2 min read How to Make a Histogram in Excel (2026) Histograms visualize the distribution of a single numeric variable — spotting normality, outliers, and spread at a glance. This guide … Read more

How to Make a Gantt Chart in Excel (2026)

How to Make a Gantt Chart in Excel (2026)

How to Make a Gantt Chart in Excel (2026 Guide) Sheets & Cells Functions Charts Google Sheets Comparisons Excel AI Home›Excel Charts›Make a Gantt Chart ExcelHow-To⏱ 4 min read How to Make a Gantt Chart in Excel (2026) Excel has no native Gantt chart, but you can build a clean one from a stacked bar … Read more

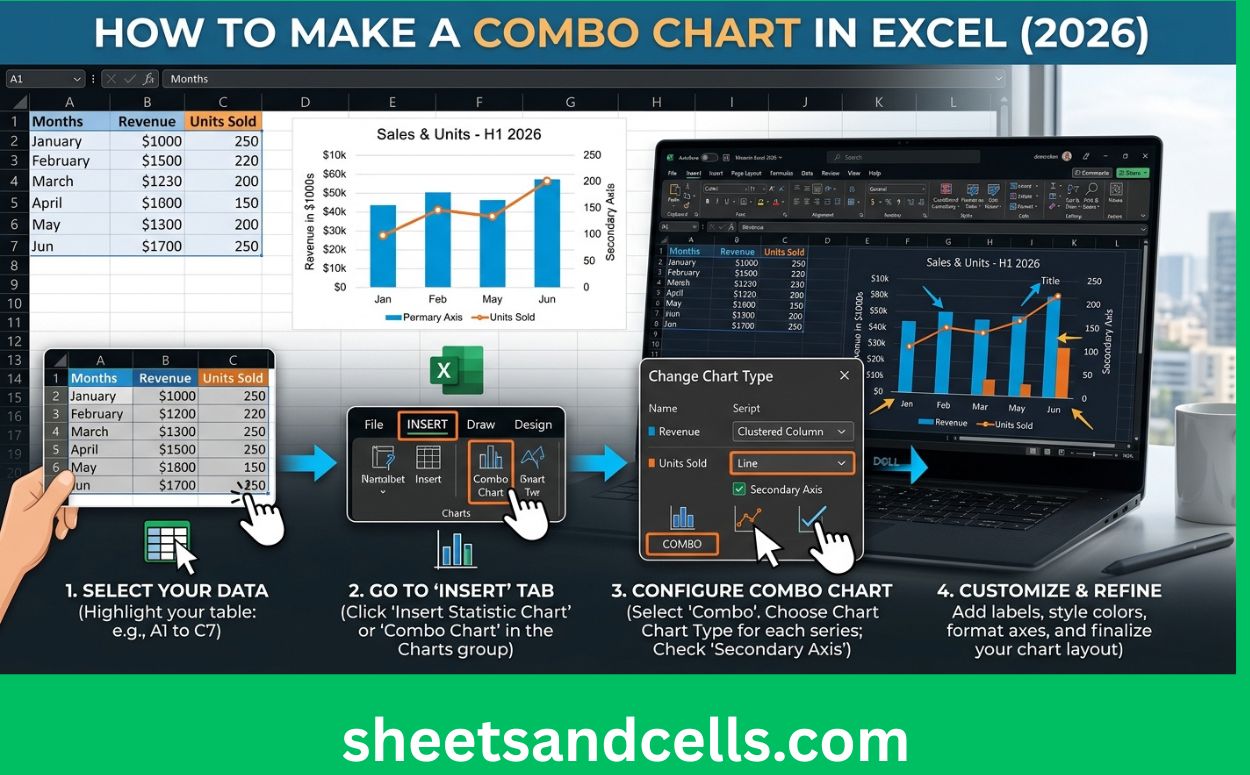
How to Make a Combo Chart in Excel (2026)

How to Make a Combo Chart in Excel (2026)

How to Make a Combo Chart in Excel (2026 Guide) Sheets & Cells Functions Charts Google Sheets Comparisons Excel AI Home›Excel Charts›Make a Combo Chart ExcelHow-To⏱ 3 min read How to Make a Combo Chart in Excel (2026) Combo charts combine two chart types — usually bars with a line overlay — to show related … Read more

How to Make a Pie Chart in Excel (2026)

How to Make a Pie Chart in Excel (2026)

How to Make a Pie Chart in Excel (2026 Guide) Sheets & Cells Functions Charts Google Sheets Comparisons Excel AI Home›Excel Charts›Make a Pie Chart ExcelHow-To⏱ 2 min read How to Make a Pie Chart in Excel (2026) Pie charts show part-to-whole relationships. This guide covers how to build one, when they work, and — … Read more

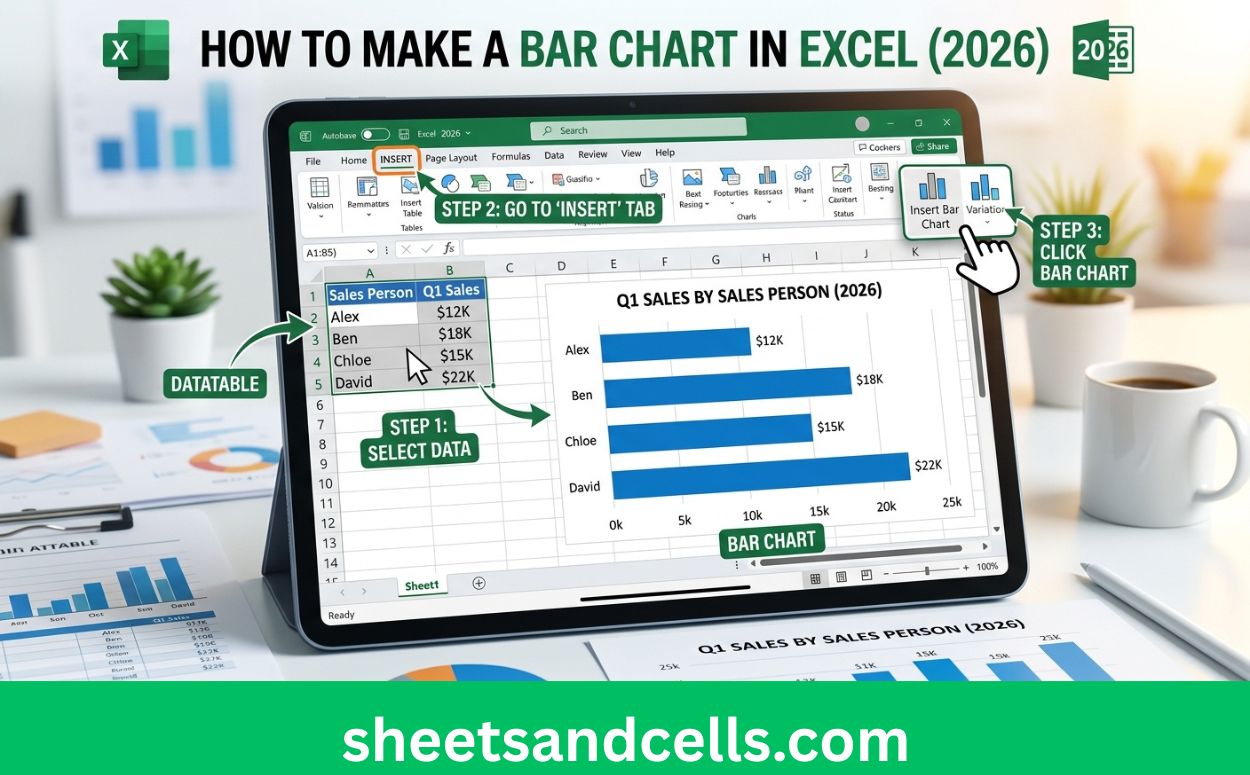
How to Make a Bar Chart in Excel (2026)

How to Make a Bar Chart in Excel (2026)

How to Make a Bar Chart in Excel (2026 Guide) Sheets & Cells Functions Charts Google Sheets Comparisons Excel AI Home›Excel Charts›Make a Bar Chart ExcelHow-To⏱ 2 min read How to Make a Bar Chart in Excel (2026) Bar charts are Excel’s most common chart type — comparing categories, showing rankings, or displaying frequencies. This … Read more